Diffusion Tensor Imaging Tractography of White Matter Tracts in the Equine Brain
 Samuel Boucher1*†
  Germain Arribarat1†
  Benjamin Cartiaux2
  Elodie Anne Lallemand3
  Patrice Péran1 Alexandra Deviers4‡
  Giovanni Mogicato4‡
- 1ToNIC, Toulouse NeuroImaging Center, Université de Toulouse, INSERM, UPS, Toulouse, France
- 2INSERM UMR1037, Cancer Research Center of Toulouse, Oncopole, Toulouse, France
- 3INTHERES, Université de Toulouse, INRA, ENVT, Toulouse, France
- 4ToNIC, Toulouse NeuroImaging Center, Université de Toulouse, INSERM, UPS, ENVT, Toulouse, France
Tractography, a noninvasive technique tracing brain pathways from diffusion tensor magnetic resonance imaging (DTI) data, is increasingly being used for brain investigation of domestic mammals. In the equine species, such a technique could be useful to improve our knowledge about structural connectivity or to assess structural changes of white matter tracts potentially associated with neurodegenerative diseases. The goals of the present study were to establish the feasibility of DTI tractography in the equine brain and to provide a morphologic description of the most representative tracts in this species. Postmortem DTI and susceptibility-weighted imaging (SWI) of an equine brain were acquired with a 3-T system using a head coil. Association, commissural, and projection fibers, the three fiber groups typically investigated in tractography studies, were successfully reconstructed and overlaid on SWI or fractional anisotropy maps. The fibers derived from DTI correlate well with their description in anatomical textbooks. Our results demonstrate the feasibility of using postmortem DTI data to reconstruct the main white matter tracts of the equine brain. Further DTI acquisitions and corresponding dissections of equine brains will be necessary to validate these findings and create an equine stereotaxic white matter atlas that could be used in future neuroimaging research.
Introduction
Diffusion tensor imaging (DTI) is one of the most popular and widely used (1) MRI techniques in brain research to describe the orientation of white matter fibers. The process of fiber tracking, called tractography, allows for a virtual dissection and three-dimensional representation of white matter tracts (2).
As DTI tractography assesses the structural integrity of white matter, it has been widely used for prognostic and/or diagnostic purposes in various brain pathologies such as stroke (3–6), neurodegenerative diseases (7–11), and brain tumors (12). With the increasing availability of high-field-strength MRI (1.5 and 3 T) in veterinary facilities (13–17), the use of this technique is now gradually growing for the description of white matter anatomy and structural connectivity of domestic mammals (dog, cat, ferret, and sheep) (18–27). These collected anatomical data are of particular interest as they might have applications in both veterinary medicine and experimental research. Indeed, large animals are now increasingly seen as valuable models with regard to comparative neuropathology because they can spontaneously reproduce some human brain diseases [such as Alzheimer's disease (28, 29), Parkinson's disease (30, 31), lysosomal storage diseases (32, 33), or gliomas (34)] and be examined with the same MRI devices used in human medicine.
However, the validation of tractography in large animals requires prior knowledge of the morphology of white matter tracts. In a recent study, Pascalau et al. (35) used a fiber dissection technique to provide a detailed anatomical description of the main association, commissural, and projection fibers of the dog, cat, and horse. This study, which was the first to describe the spatial anatomy of white matter tracts in the horse, has still not been complemented by DTI tractography in the equine brain. Yet poorly understood neurodegenerative diseases affecting horses such as equine degenerative myeloencephalopathy or nigropallidal encephalomalacia would greatly benefit from the use of DTI tractography as this technique should identify damages in specific white matter tracts and correlate them with clinical symptoms. DTI tractography could also be used in healthy brains in order to improve our knowledge about anatomy and function of the equine brain by mapping its structural connectivity.
Tractography, the only noninvasive way to capture the three-dimensional anatomy of white matter tracts, appears as an exciting method to study the equine brain in the clinical or research setting. In this context, the goal of the present study was to evaluate the ability of DTI tractography to characterize the equine brain fiber bundles. To achieve this, the reconstruction of the most representative tracts was investigated, and the fiber tracking results were compared to the description of these tracts in the literature.
Methods
Animal Sampling
A 12-year-old French Standardbred mare (bodyweight = 553 kg) was euthanized for medical reasons unrelated to neurological disease. Immediately after euthanasia, the brain was extracted from the skull and fixed for 1 month in 10% formalin solution.
MRI Acquisition and Preprocessing
MRI examination was performed at the Institute for Brain Sciences of Toulouse using a high-field 3.0-T magnet (Philips ACHIEVA dStream) and a head coil for signal reception. Twenty-four hours before MRI acquisition, the brain was rinsed with water and submerged in a 0.9% saline solution (NaCl). Just before starting acquisition, the brain was placed in an MRI-compatible container (zip-locked hermetic plastic bag) totally filled with saline solution. After being gently agitated in order to manually remove air bubbles, the bag was closed and then placed in a foam mold. The space between the bag and the concavity of the mold was filled with cotton balls in order to prevent motion of the bag during acquisition (36). The imaging protocol comprised T1-weighted images using a gradient-echo sequence (repetition time 7.72 ms; echo time 3.64 ms; voxel size 1 × 1 × 1 mm, and matrix 240 × 240 × 180); T2-weighted images using a spin-echo sequence (repetition time 286 ms; echo time 1,500 ms; voxel size 1 × 1 × 1 mm, and matrix 240 × 240 × 180); susceptibility-weighted imaging (SWI) using a gradient-echo sequence [repetition time 186 ms; multi-echo (n = 22; TE1 = 3.20; dTE = 2.70 ms), voxel size 0.7 × 0.7 × 1 mm, and matrix 288 × 288 × 200); and diffusion-weighted images using a spin-echo sequence (repetition time 11.5 s, echo time 76.1 ms, flip angle 90°, voxel size 1.97 × 1.97 × 2 mm, matrix 112 × 112 × 48, 64 independent directions, and b-value 3,000 s/mm2). The diffusion sequences were implemented from preexisting sequences that had already been used in the laboratory to carry out tractography of an ex vivo equine brain (37). The acquisition time was 12 min, which was repeated five times for averaging, for a total acquisition time of 1 h. Raw diffusion-weighted data were denoised using an LPCA filter with a Rician noise model (38) on MATLAB (MathWorks, Inc., MA, USA). The data were then corrected for geometric distortion due to eddy currents using DSI Studio. T1- and T2-weighted images were registered to b0 images using the C++ toolbox ANTS (39). T1-weighted, T2-weighted, and susceptibility-weighted images were useful for anatomical reference and three-dimensional rendering of the brain. T2-weighted images were registered to b0, and then T1-weighted images were registered to T2-weighted images. The susceptibility-weighted images were first down-sampled to match the resolution of the DTI images, and then a linear rigid-body registration based on the ANTS registration algorithm was performed (39). These “down-sampled” susceptibility-weighted images, which were perfectly realigned with the DTI, were used to guide region-of-interest (ROI) placement. On the other hand, we decided to use the original high-resolution susceptibility-weighted images for the presentation of ROI and tracking results, due to the excellent visual quality of these images. We used the linear affine registration of DSI Studio to realign the high-resolution SWI with the DTI, through the down-sampled SWI. Even if the high-resolution SWI was not perfectly realigned, these images allow a better visualization of the results.
DTI Reconstruction
For this study, the reconstruction was done on DSI Studio; the DTI reconstruction follows the Basser method (40). To model the diffusion phenomenon, the diffusion tensor model described by Basser et al. (41) was used. This model is based upon a three-dimensional model of Gaussian diffusion displacements.
D is calculated for each voxel based on the b0 reference image and all the diffusion-weighted images. To obtain a visualization of the tensor, the matrix D needs to be diagonalized to obtain the three eigenvalues λ1 λ2 λ3 and the three eigenvectors v1 v2 v3. So diffusion tensor can be described as an ellipsoid.
Mean Diffusivity and Fractional Anisotropy
Mean diffusivity (MD) consists in the calculation of the mean value of the three eigenvalues. This leads to a parametric map of the diffusivity for each voxel, without taking into account the direction of diffusion. Once MD has been calculated, fractional anisotropy (FA) can be retrieved. FA comprised between 0 and 1, 0 being a voxel where the diffusion is totally isotropic and 1 an anisotropic voxel (one direction is preponderant).
Since water diffusion is restricted in white matter tracts, a voxel containing fibers will have a high FA value. The three values of the first eigenvector v1 were assigned to the red, green, and blue channel to obtain a colored image for which every single color represents a distinct fiber orientation (red: right–left, green: ventral–dorsal, and blue: rostral–caudal).
Tractography
A deterministic tracking method was chosen (42) as it seems to achieve the highest valid connection compared to other fiber tracking approaches. As only one brain was scanned in our study, we assume that a deterministic tracking should improve stability and be less subjected to individual differences than a probabilistic tracking.
ROI and Region-of-Avoidance (ROA) Delineation
For each tract, ROIs were delineated manually, and sometimes one or several ROAs were additionally placed in order to specifically segregate fibers of interest. Regions were placed using anatomical descriptions of T1- and T2-weighted images of the equine brain (14, 15), dissection of major white matter tracts in the equine brain (35), and a human tractography atlas (2). Color-coded FA maps and down-sampled SWI were used to place ROI and ROA. Sometimes, ROIs were used as seed for better results. ROIs were delineated on dorsal planes for the arcuate fasciculus, the uncinate fasciculus, the inferior longitudinal fasciculus, and the inferior fronto-occipital fasciculus; on transversal planes for the cingulum and internal capsule; and on both sagittal and transversal planes for commissural fibers. Representative color-coded FA maps and three-dimensional representation of ROIs are displayed in Supplementary Figures 1, 2.
Results
Association, commissural, and projection fibers are the three fiber groups typically investigated in tractography studies. White matter tracts of these three groups were successfully reconstructed in our study.
Association Fibers
Association fibers, which connect distant or neighboring gyri in the same hemisphere, form different bundles; the most investigated in tractography studies are the superior and inferior longitudinal fasciculi, the uncinate fasciculus, the inferior fronto-occipital fasciculus, and the cingulum. The superior longitudinal fasciculus (or arcuate fasciculus) is a lateral bundle bending dorsally to the claustrum; it is composed of long and short fibers connecting Sylvian gyri to the occipital cortex (Figure 1).
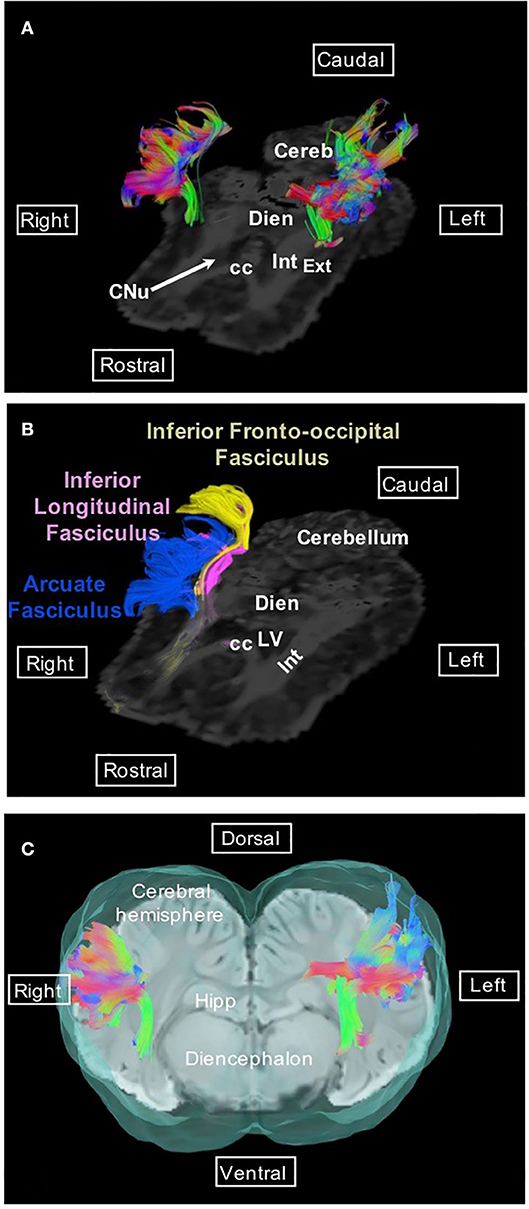
Figure 1. Arcuate fasciculus. (A) Dorsal view of the arcuate fasciculus overlaid on the FA map. (B) Dorsal view of the arcuate fasciculus (blue), inferior longitudinal fasciculus (pink), and inferior fronto-occipital fasciculus (yellow) overlaid on the FA map. (C) Transversal view of the arcuate fasciculus overlaid on SWI and the isosurface of the brain. Directional colors are green, ventral to dorsal (or dorsal to ventral); blue, rostral to caudal (or caudal to rostral); red, right to left (or left to right). cc, corpus callosum; Cereb, cerebellum; CNu, caudate nucleus; Dien, diencephalon; Ext, external capsule; Hipp, hippocampus; Int, internal capsule; LV, lateral ventricle.
The inferior longitudinal fasciculus, the uncinate fasciculus and the inferior fronto-occipital fasciculus are ventral bundles respectively connecting the temporal lobe to the occipital lobe, insula to the frontal lobe, and the frontal lobe to the occipital lobe (Figure 2). The inferior fronto-occipital fasciculus is parallel and medial to the inferior longitudinal fasciculus within the occipital lobe and parallel to the uncinate fasciculus within the temporal lobe.
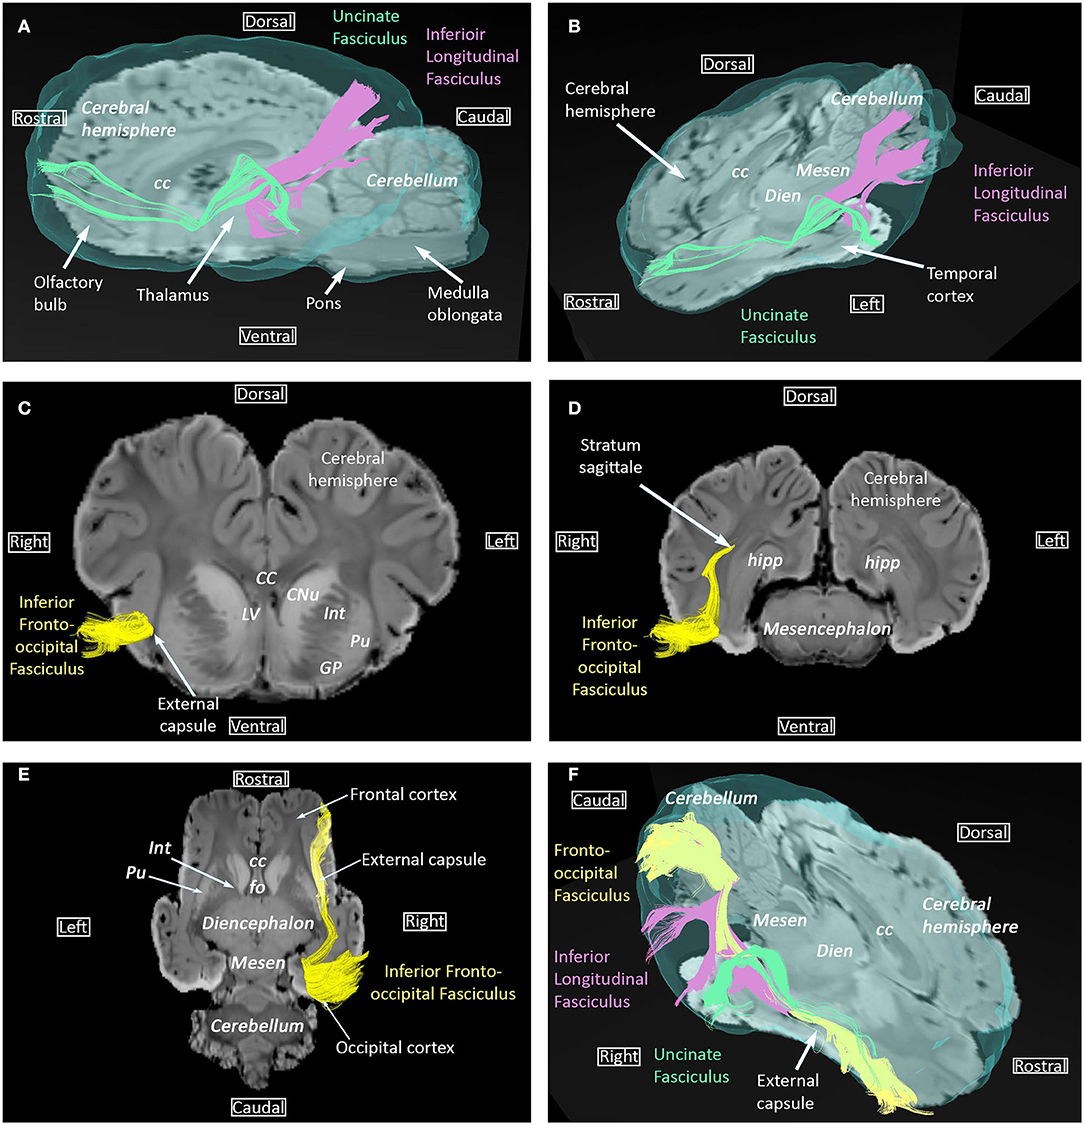
Figure 2. Inferior longitudinal fasciculus, uncinate fasciculus, and inferior fronto-occipital fasciculus. (A) Sagittal view of the uncinate (green) and inferior longitudinal (pink) fasciculi overlaid on SWI and the isosurface of the brain. (B) Dorsal and sagittal views of the uncinate (green) and inferior longitudinal (pink) fasciculi overlaid on SWI and the isosurface of the brain. (C,D) Transversal views of the inferior fronto-occipital fasciculus overlaid on SWI, at telencephalon and mesencephalon levels, respectively. (E) Dorsal view of the inferior fronto-occipital fasciculus overlaid on SWI. (F) Dorsal and sagittal views of the uncinate (green), inferior longitudinal (pink), and inferior fronto-occipital (yellow) fasciculi overlaid on SWI and the isosurface of the brain. cc, corpus callosum; CNu, caudate nucleus; Dien, diencephalon; fo, fornix; GP, globus pallidus; Hipp, hippocampus; Int, internal capsule; LV, lateral ventricle; Mesen, mesencephalon; Pu, putamen.
The cingulum, which is part of the limbic system, is a medial bundle that runs in the depth of the cingulated gyrus. It is connected to the frontal, parietal, and occipital lobes (Figures 3A,C,E).
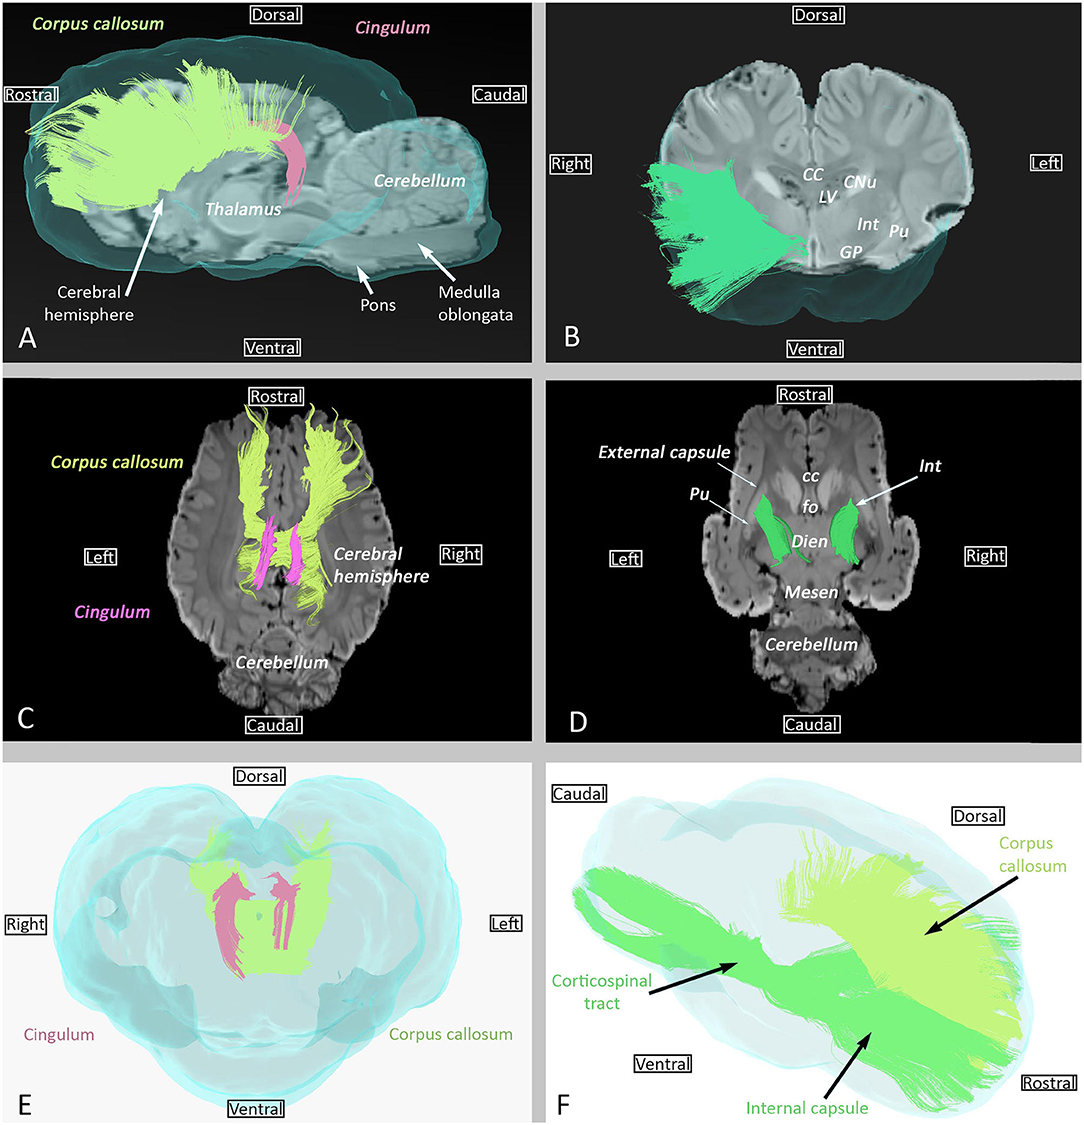
Figure 3. Examples of association (cingulum), commissural (corpus callosum), and projection (internal capsule) fibers. (A) Sagittal view of cingulum (pink) and corpus callosum (lime green) overlaid on SWI and the isosurface of the brain. (B) Transversal view of the internal capsule overlaid on SWI and the isosurface of the brain. (C) Dorsal view of cingulum (pink) and corpus callosum (lime green) overlaid on SWI. (D) Dorsal view of the internal capsule overlaid on SWI. (E) Transverse rostral view of cingulum (pink) and corpus callosum (lime green) overlaid on the isosurface of the brain. (F) Sagittal view of the internal capsule (green) and corpus callosum (lime green) overlaid on the isosurface of the brain. cc, corpus callosum; CNu, caudate nucleus; Dien, diencephalon; fo, fornix; GP, globus pallidus; Int, internal capsule; LV, Lateral ventricle; Mesen, mesencephalon; Pu, putamen.
Commissural Fibers
Commissural fibers, which cross the midline to connect homolog cortical areas, are present in three particular bundles: corpus callosum, rostral commissure, and fornix commissure (Figures 3, 4). The corpus callosum is composed of decussating fibers which connect neopallial areas. These fibers form the ceiling of the lateral ventricles and cross those of the corona radiata in the centrum semiovale (Figure 3F). The corpus callosum is divided into a rostral part (genu) connecting frontal areas, a central part (body) connecting parietal and temporal areas, and a caudal part (splenium) connecting occipital lobes. The rostral commissure is composed of transverse fibers located in the lamina terminalis, rostrally to the columns of the fornix (Figure 4D). The rostral and caudal parts of the rostral commissure are respectively composed of fibers running in the olfactory bulbs and tubercles and fibers crossing the rostral edge of the lentiform nucleus to reach the piriform and temporal lobes (Figures 4B,D). Fibers of the fornix commissure connect the two hippocampi. The fornix is made of two C-shaped bundles, one on each side, originating in the fimbria and running to the hypothalamus (Figures 4C, D). Joined to each other on the midline to form the body, these bundles are separated rostrally and caudally to form the columns and crura of the fornix, respectively.
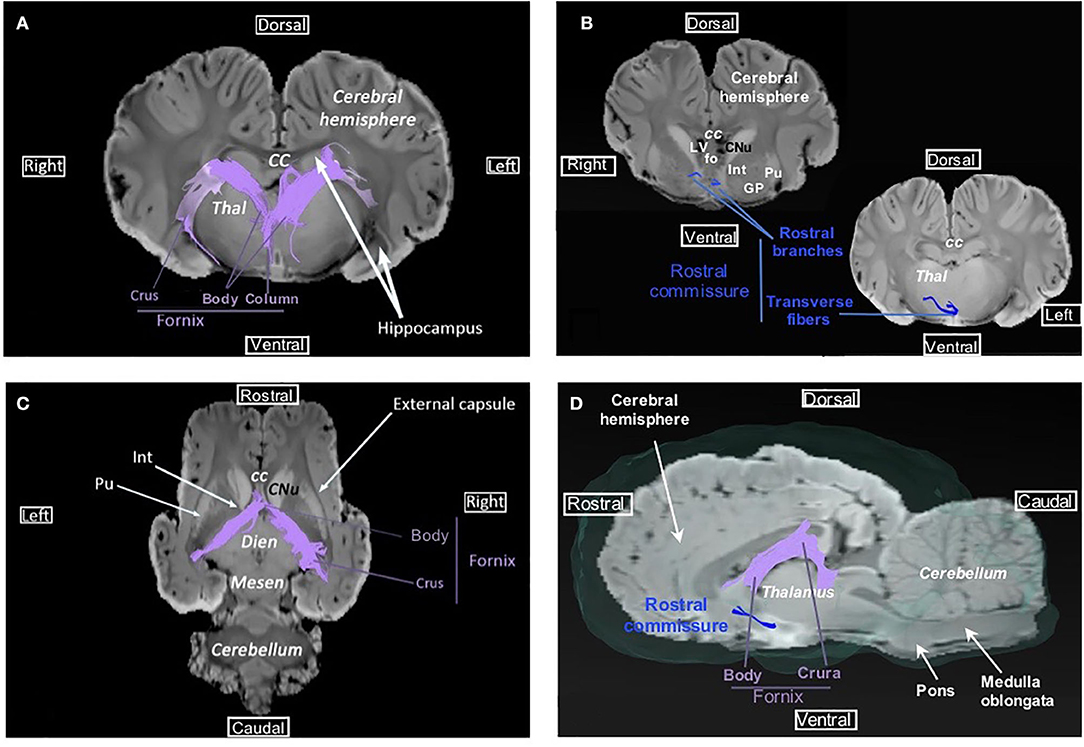
Figure 4. Fornix and rostral commissure. (A) Transversal view of fornix overlaid on SWI. (B) Transversal view of the rostral commissure (at the lentiform nucleus level and at the thalamus level) overlaid on SWI. (C) Dorsal view of fornix overlaid on SWI. (D) Sagittal view of the rostral commissure and fornix overlaid on SWI and the isosurface of the brain. cc, corpus callosum; CNu, caudate nucleus; Dien, diencephalon; fo, fornix; GP, globus pallidus; Int, internal capsule; LV, lateral ventricle; Mesen, mesencephalon; Pu, putamen; Thal, thalamus.
Projection Fibers
Projection fibers connect the cerebral cortex with other parts of the nervous system (deep nuclei, brainstem, cerebellum, and spinal cord). The internal capsule and corona radiata, the most important projection fiber complex, contain corticopetal fibers and corticofugal fibers. Corticopetal fibers connect the thalamus and metathalamus to the cerebral cortex; corticofugal fibers leave the cortex to reach the mesencephalon (corticomesencephalic tract), pons (corticopontine tract), cerebellum (cortico-ponto-cerebellar tract), ventral rhombencephalon (corticobulbar tract), and spinal cord (corticospinal tract). In this study, it was not possible to differentiate between these different tracts. The internal capsule is displayed in Figures 3B,D,F).
Discussion
The goal of this study was to develop the methodology (imaging protocol and placement of seed ROI) for DTI tractography of the main white matter tracts of the horse. The three fiber groups (association, commissural, and projection fibers) known from classical anatomy have been successfully reconstructed by tractography using a formalin-fixed equine brain. A previous study conducted in the laboratory with a different reconstruction method had already shown the feasibility of tractography in an ex vivo equine brain (37) but had failed to identify the association pathways displayed in the present study. So this study is the first one, to our knowledge, to provide a complete anatomical description of the reconstructed fiber bundles of the equine brain.
Anatomy of the association, commissural, and projection fibers reconstructed in this study correlates well with the description of these fibers in anatomical textbooks. However, comparison of our results with those of the fiber dissection study of Pascalau et al. performed on equine brains shows discrepancies concerning the cingulum, for which the parietal and occipital radiations described by Pascalau et al. could not be observed in our study and the inferior fronto-occipital fasciculus was reconstructed in our study while it could not be identified by dissection (35). As DTI tractography provides an indirect characterization of axonal pathways based on the diffusion of water molecules, it hardly differentiates crossing and branching patterns in an individual voxel. Tractography algorithms can lead to false connections or premature terminations of tracked fibers and thus be responsible for an anatomical inaccuracy between MRI-derived reconstruction and dissection (43). Similarly to our findings regarding the inferior fronto-occipital fasciculus, reconstruction of tracts that could not be identified on gross anatomical dissection has already been reported for the feline inferior fronto-occipital fasciculus (24, 25, 27, 35) and the human superior fronto-occipital fasciculus (44, 45). For this latter fasciculus, modeling errors are assumed to have generated false continuations between different projection fibers, thus leading to the reconstruction of a continuous fronto-occipital fiber bundle (45). Even if modeling errors should be considered in our study, the trajectory of our reconstructed inferior fronto-occipital fasciculus (fibers coursing through the ventral external capsule and the stratum sagittale, Figures 2C,D) and the location relative to the uncinate and inferior longitudinal fasciculi (Figure 2F) are consistent with the literature (19, 20). Additional studies comparing tractography and dissection with a larger number of brains are needed to determine whether this fronto-occipital fasciculus is present or not in horses.
Other factors may have influenced the anatomical accuracy of tracked fibers, notably the operator dependence of ROI placement and the quality of ex vivo DTI data. Even if manual delineation of ROI is prone to generate biases, it was not possible to use automated segmentation as stereotaxic white matter atlases based on DTI are not available in the equine species. A freely available standard stereotaxic brain atlas was recently published for horses (16), but it does not contain DTI data. The creation of a tractography atlas could be a potential evolution of the present work. Indeed, once the imaging protocol and the methodology developed in this study are applied to a large number of horses, the reconstructed tracts could be co-registered to the equine stereotaxic brain atlas.
As the specimen used in this study is a brain extracted from the skull and fixed with formalin, the quality of MRI data may have been impacted both by fixation-induced tissue changes and by magnetic susceptibility artifacts at the tissue–air interface. For postmortem DTI acquisitions, the brain must be fixed in order to stop autolysis that degrades in vivo structural characteristics. While the fixation process causes a decrease in overall water diffusion compared to in vivo, its impact on diffusion anisotropy is still not well characterized with studies reporting a decrease in anisotropy in the fixed brain (46, 47) and others suggesting a preservation of relevant tissue microstructures by the fixative (48–51). In order to minimize the fixation-induced diffusion changes and their impact on the fiber tracking results, the brain was fixed within a very short time after death to avoid autolysis (52) and immersed in formalin for 1 month to allow homogeneous fixation of the whole brain (53), and the b-value was increased (3,000 s/mm2) in order to accommodate for the reduced diffusion of water molecules (46). Concerning magnetic susceptibility artifacts, the brain was immersed in a container filled with saline solution during acquisition in order to minimize them. Saline solution is meant to have an isosignal with the cerebrospinal fluid. Despite these precautions, postmortem conditions might have led to a decrease in the number of reconstructed fibers and/or to shorter fibers compared to what would have been obtained in vivo (47). The impact of fixation on the fiber outcome remains however difficult to estimate, since the few studies comparing in vivo and ex vivo tractography show variable results and quality of ex vivo tractography is also modulated by the fixation protocol, spatial resolution of images, diffusion weighting, and method of reconstruction (47, 54).
The use of advanced MRI techniques in clinical practice offers the opportunity to better understand the mechanisms of neurological diseases of the horse and to improve their diagnosis. In the research setting, the implementation of such advanced MRI techniques often use postmortem samples, as exemplified by the two most recent MRI studies of the normal equine brain (15, 16). Indeed, in addition to the constraints related to the adaptation of facilities for equine neuroimaging, the development of MRI tools in neurologically healthy horses poses the ethical problem of performing a general anesthesia for an MRI examination which is not medically warranted. Furthermore, using postmortem brains has the advantage of performing multiple imaging protocols in a single setting for comparison, as the scanning time is not a limitation. As access of horses to high-field MRI is likely to become more common in the future, the advanced MRI methods developed in postmortem samples may be soon translated into the clinical field. Hence, the DTI protocol of this study was implemented in order to achieve sufficient image quality for fiber tracking while maintaining an adequate scanning time for future in vivo use. This scanning time will be compatible with anesthesia as it may be significantly reduced in in vivo conditions. Indeed, repetition of acquisitions, which had to be carried out five times (12 min × 5) on average to obtain a greater signal in our postmortem study, will no longer be necessary as the signal will naturally be greater. Likewise, the b-value, which was high in this study (3,000) to be sensitive to the diffusion phenomenon, could be decreased to 1,000 in in vivo conditions for DTI deterministic tractography, possibly reducing the acquisition time.
Other methods of reconstruction could have been considered. DTI reconstruction was our first choice, since it is the most popular and widely used (1) for fiber exploration and thus the most reproducible. However, when a high angular resolution and thus a high number of directions are used for acquisition, other reconstructions can be performed. One of them is the Q-ball imaging (QBI) reconstruction which differs from DTI reconstruction by taking multiple fiber orientations into account instead of only giving an ellipsoid. Hence, QBI could be especially useful in the case of multiple fibers crossing in one voxel mentioned above. We plan to compare, in future studies, fiber tracking obtained with QBI to that obtained with DTI. Even if directions and b-value were initially chosen to be optimal for the DTI method, we ensured that our protocol was as close as possible to the future QBI acquisition.
The use of a single brain is an important limitation of our study, since it prevents the analysis of fiber bundle anatomy according to age, sex, and breed. Our study only provides the methodological tools (imaging protocol and placement of seed ROI) necessary for carrying out such anatomical studies. The use of a single brain also precludes any assessment of tract consistency from one brain to another. Since the anatomy of the reconstructed fiber bundles is consistent with the literature, the placement of ROIs seems to be appropriate and should normally lead to the same fiber tracking results in other brains. However, further large-cohort DTI studies are critical to validate and/or optimize the methodology developed in the present work and to investigate the characteristics of the equine white matter anatomy.
To conclude, our results demonstrate the feasibility of using postmortem DTI data to reconstruct the main white matter tracts of the equine brain. Further DTI acquisitions and corresponding dissections of equine brains are needed to validate these findings and create a tractography atlas that could be used in equine neuroimaging research.
Data Availability Statement
The datasets generated for this study are available on request to the corresponding author.
Ethics Statement
This study used animal tissue after euthanasia and was exempt from ethics approval. Written informed consent was obtained from the owners for the participation of their animals in this study.
Author Contributions
SB: writing—original draft, conceptualization, methodology, and visualization. GA: writing—original draft, conceptualization, and methodology. BC: conceptualization and resources. EL: resources. PP: supervision. AD and GM: writing—review and editing and conceptualization. All authors contributed to the article and approved the submitted version.
Conflict of Interest
The authors declare that the research was conducted in the absence of any commercial or financial relationships that could be construed as a potential conflict of interest.
Acknowledgments
We thank the Inserm/UPS UMR1214 Technical Platform for the MRI acquisitions.
Supplementary Material
The Supplementary Material for this article can be found online at: https://www.frontiersin.org/articles/10.3389/fvets.2020.00382/full#supplementary-material
References
1. Assaf Y, Pasternak O. Diffusion tensor imaging (DTI)-based white matter mapping in brain research: a review. J. Mol. Neurosci. (2008) 34:51–61. doi: 10.1007/s12031-007-0029-0
2. Catani M, Thiebautdeschotten M. A diffusion tensor imaging tractography atlas for virtual in vivo dissections. Cortex. (2008) 44:1105–32. doi: 10.1016/j.cortex.2008.05.004
3. Moller M, Frandsen J, Andersen G, Gjedde A, Vestergaard-Poulsen P, Ostergaard L. Dynamic changes in corticospinal tracts after stroke detected by fibretracking. J Neurol Neurosurg Psychiatry. (2007) 78:587–92. doi: 10.1136/jnnp.2006.100248
4. Cho S-H, Kim DG, Kim D-S, Kim Y-H, Lee C-H, Jang SH. Motor outcome according to the integrity of the corticospinal tract determined by diffusion tensor tractography in the early stage of corona radiata infarct. Neurosci Lett. (2007) 426:123–7. doi: 10.1016/j.neulet.2007.08.049
5. Urbanski M, Thiebaut de Schotten M, Rodrigo S, Oppenheim C, Touzé E, Méder JF, et al. DTI-MR tractography of white matter damage in stroke patients with neglect. Exp Brain Res. (2011) 208:491–505. doi: 10.1007/s00221-010-2496-8
6. Cheng C-Y, Hsu C-Y, Huang Y-C, Tsai Y-H, Hsu H-T, Yang W-H, et al. Motor outcome of deep intracerebral haemorrhage in diffusion tensor imaging: comparison of data from different locations along the corticospinal tract. Neurol. Res. (2015) 37:774–81. doi: 10.1179/1743132815Y.0000000050
7. Lee W, Park B, Han K. Classification of diffusion tensor images for the early detection of Alzheimer's disease. Comput Biol Med. (2013) 43:1313–20. doi: 10.1016/j.compbiomed.2013.07.004
8. Lee S-H, Coutu J-P, Wilkens P, Yendiki A, Rosas HD, Salat DH. Tract-based analysis of white matter degeneration in Alzheimer's disease. Neuroscience. (2015) 301:79–89. doi: 10.1016/j.neuroscience.2015.05.049
9. Tan WQ, Yeoh C-S, Rumpel H, Nadkarni N, Lye W-K, Tan E-K, et al. Deterministic tractography of the nigrostriatal-nigropallidal pathway in Parkinson's disease. Sci Rep. (2015) 5:17283. doi: 10.1038/srep17283
10. Fischer FU, Wolf D, Scheurich A, Fellgiebel A. Altered whole-brain white matter networks in preclinical Alzheimer's disease, NeuroImage Clin. (2015) 8:660–6. doi: 10.1016/j.nicl.2015.06.007
11. Daianu M, Mendez MF, Baboyan VG, Jin Y, Melrose RJ, Jimenez EE, et al. An advanced white matter tract analysis in frontotemporal dementia and early-onset Alzheimer's disease. Brain Imaging Behav. (2016) 10:1038–53. doi: 10.1007/s11682-015-9458-5
12. Berberat J, McNamara J, Remonda L, Bodis S, Rogers S. Diffusion tensor imaging for target volume definition in glioblastoma multiforme. Strahlenther Onkol. (2014) 190:939–43. doi: 10.1007/s00066-014-0676-3
13. Gray-Edwards HL, Salibi N, Josephson EM, Hudson JA, Cox NR, Randle AN, et al. High resolution MRI anatomy of the cat brain at 3Tesla. J Neurosci Methods. (2014) 227:10–7. doi: 10.1016/j.jneumeth.2014.01.035
14. Stuckenschneider K, Hellige M, Feige K, Gasse H. 3-Tesla magnetic resonance imaging of the equine brain in healthy horses - Potentials and limitations. Pferdeheilkunde. (2014) 30:657–70. doi: 10.21836/PEM20140605
15. Schmidt MJ, Knemeyer C, Heinsen H. Neuroanatomy of the equine brain as revealed by high-field (3Tesla) magnetic-resonance-imaging. PLoS One. (2019) 14:e0213814. doi: 10.1371/journal.pone.0213814
16. Johnson PJ, Janvier V, Luh W-M, FitzMaurice M, Southard T, Barry EF. Equine stereotaxtic population average brain atlas with neuroanatomic correlation. Front. Neuroanat. (2019) 13:89. doi: 10.3389/fnana.2019.00089
17. Liu X, Tian R, Zuo Z, Zhao H, Wu L, Zhuo Y, et al. A high-resolution MRI brain template for adult Beagle. Magn Reson Imaging. (2020) 68:148–57. doi: 10.1016/j.mri.2020.01.003
18. Takahashi E, Dai G, Wang R, Ohki K, Rosen GD, Galaburda AM, et al. Development of cerebral fiber pathways in cats revealed by diffusion spectrum imaging. NeuroImage. (2010) 49:1231–40. doi: 10.1016/j.neuroimage.2009.09.002
19. Jacqmot O, Van Thielen B, Fierens Y, Hammond M, Willekens I, Van Schuerbeek P, et al. Diffusion tensor imaging of white matter tracts in the dog brain: diffusion tensor imaging. Anat Rec. (2013) 296:340–9. doi: 10.1002/ar.22638
20. Anaya García MS, Hernández Anaya JS, Marrufo Meléndez O, Velázquez Ramírez JL, Palacios Aguiar R. In vivo study of cerebral white matter in the dog using diffusion tensor tractography. Vet Radiol Ultrasound. (2015) 56:188–95. doi: 10.1111/vru.12211
21. Lee W, Lee SD, Park MY, Foley L, Purcell-Estabrook E, Kim H, et al. Functional and diffusion tensor magnetic resonance imaging of the sheep brain. BMC Vet Res. (2015) 11:262. doi: 10.1186/s12917-015-0581-8
22. Robinson JL, Baxi M, Katz JS, Waggoner P, Beyers R, Morrison E, et al. Characterization of structural connectivity of the default mode network in dogs using diffusion tensor imaging. Sci Rep. (2016) 6:36851. doi: 10.1038/srep36851
23. Dai G, Das A, Hayashi E, Chen Q, Takahashi E. Regional variation of white matter development in the cat brain revealed by ex vivo diffusion MR tractography. Int J Dev Neurosci. (2016) 54:32–8. doi: 10.1016/j.ijdevneu.2016.08.004
24. Jacqmot O, Van Thielen B, Michotte A, Willekens I, Verhelle F, Goossens P, et al. Comparison of several white matter tracts in feline and canine brain by using magnetic resonance diffusion tensor imaging. Anat Rec. (2017) 300:1270–89. doi: 10.1002/ar.23579
25. Das A, Takahashi E. Characterization of white matter tracts by diffusion MR tractography in cat and ferret that have similar gyral patterns. Cereb Cortex. (2018) 28:1338–47. doi: 10.1093/cercor/bhx048
26. Pieri V, Trovatelli M, Cadioli M, Zani DD, Brizzola S, Ravasio G, et al. In vivo diffusion tensor magnetic resonance tractography of the sheep brain: an atlas of the ovine white matter fiber bundles. Front Vet Sci. (2019) 6:345. doi: 10.3389/fvets.2019.00345
27. Johnson PJ, Pascalau R, Luh W-M, Raj A, Cerda-Gonzalez S, Barry EF. Stereotaxic diffusion tensor imaging white matter atlas for the in vivo domestic feline brain. Front Neuroanat. (2020) 14:1. doi: 10.3389/fnana.2020.00001
28. Chambers JK, Tokuda T, Uchida K, Ishii R, Tatebe H, Takahashi E, et al. The domestic cat as a natural animal model of Alzheimer's disease. Acta Neuropathol Commun. (2015) 3:78. doi: 10.1186/s40478-015-0258-3
29. Schmidt F, Willems N, Stolzing A. Detection and quantification of A-amyloid, pyroglutamyl AA, and tau in aged canines. J Neuropathol Exp Neurol. (2015) 74:12. doi: 10.1097/NEN.0000000000000230
30. Mcfarlane D. Advantages and limitations of the equine disease, pituitary pars intermedia dysfunction as a model of spontaneous dopaminergic neurodegenerative disease. Ageing Res Rev. (2007) 6:54–63. doi: 10.1016/j.arr.2007.02.001
31. Chang HT, Rumbeiha WK, Patterson JS, Puschner B, Knight AP. Toxic equine parkinsonism: an immunohistochemical study of 10 horses with nigropallidal encephalomalacia. Vet Pathol. (2012) 49:398–402. doi: 10.1177/0300985811406885
32. Bradbury AM, Gurda BL, Casal ML, Ponder KP, Vite CH, Haskins ME. A review of gene therapy in canine and feline models of lysosomal storage disorders. Human Gene Ther Clin Dev. (2015) 26:27–37. doi: 10.1089/humc.2015.002
33. Karageorgos L, Lancaster MJ, Nimmo JS, Hopwood JJ. Gaucher disease in sheep. J Inherit Metab Dis. (2011) 34:209–15. doi: 10.1007/s10545-010-9230-3
34. Dickinson PJ, LeCouteur RA, Higgins RJ, Bringas JR, Larson RF, Yamashita Y, et al. Canine spontaneous glioma: a translational model system for convection-enhanced delivery. Neuro Oncol. (2010) 12:928–40. doi: 10.1093/neuonc/noq046
35. Pascalau R, Aldea CC, Padurean VA, Szabo B. Comparative study of the major white matter tracts anatomy in equine, feline and canine brains by use of the fibre dissection technique. Anat Histol Embryol. (2016) 45:373–85. doi: 10.1111/ahe.12208
36. Shatil AS, Matsuda KM, Figley CR. A method for whole brain ex vivo magnetic resonance imaging with minimal susceptibility artifacts. Front. Neurol. (2016) 7:208. doi: 10.3389/fneur.2016.00208
37. Labelle F, Monteil S, Ken S, Audigie F, Gros H, Peran P, et al. Diffusion tensor imaging of white matter tracts in the normal equine brain. In: Proceedings of the 31st Conference of the European Association of Veterinary Anatomists. Vienna (2016). 45 p.
38. Manjón JV, Coupé P, Concha L, Buades A, Collins DL, Robles M. Diffusion weighted image denoising using overcomplete local PCA. PLoS One. (2013) 8:e73021. doi: 10.1371/journal.pone.0073021
40. Basser PJ, Mattiello J, Lebihan D. Estimation of the effective self-diffusion tensor from the NMR spin echo. J Magn Reson B. (1994) 103:247–54. doi: 10.1006/jmrb.1994.1037
41. Basser PJ, Mattiello J, LeBihan D. MR diffusion tensor spectroscopy and imaging. Biophys. J. (1994) 66:259–67. doi: 10.1016/S0006-3495(94)80775-1
42. Yeh F-C, Verstynen TD, Wang Y, Fernández-Miranda JC, Tseng W-YI. Deterministic diffusion fiber tracking improved by quantitative anisotropy. PLoS One. (2013) 8:e80713. doi: 10.1371/journal.pone.0080713
43. Jbabdi S, Johansen-Berg H. Tractography: where do we go from here? Brain Connect. (2011) 1:169–83. doi: 10.1089/brain.2011.0033
44. Bao Y, Wang Y, Wang W, Wang Y. The superior fronto-occipital fasciculus in the human brain revealed by diffusion spectrum imaging tractography: an anatomical reality or a methodological artifact? Front Neuroanat. (2017) 11:119. doi: 10.3389/fnana.2017.00119
45. Meola A, Comert A, Yeh F-C, Stefaneanu L, Fernandez-Miranda JC. The controversial existence of the human superior fronto-occipital fasciculus: connectome-based tractographic study with microdissection validation. Hum Brain Mapp. (2015) 36:4964–71. doi: 10.1002/hbm.22990
46. Schmierer K, Wheeler-Kingshott CA, Tozer DJ, Boulby PA, Parkes HG, Yousry TA, et al. Quantitative magnetic resonance of postmortem multiple sclerosis brain before and after fixation. Magn Reson Med. (2008) 59:268–77. doi: 10.1002/mrm.21487
47. Rane S, Duong TQ. Comparison of in vivo and ex vivo diffusion tensor imaging in rhesus macaques at short and long diffusion times. Open Neuroimag J. (2011) 5:172–8. doi: 10.2174/1874440001105010172
48. Guilfoyle DN, Helpern JA, Lim KO. Diffusion tensor imaging in fixed brain tissue at 7.0 T. NMR Biomed. (2003) 16:77–81. doi: 10.1002/nbm.814
49. Sun S-W, Neil JJ, Song S-K. Relative indices of water diffusion anisotropy are equivalent in live and formalin-fixed mouse brains. Magn Reson Med. (2003) 50:743–8. doi: 10.1002/mrm.10605
50. Sun SW, Neil JJ, Liang HF, He YY, Schmidt RE, Hsu CY, et al. Formalin fixation alters water diffusion coefficient magnitude but not anisotropy in infarcted brain. Magn Reson Med. (2005) 53:1447–51. doi: 10.1002/mrm.20488
51. D'Arceuil HE, Westmoreland S, de Crespigny JA. An approach to high resolution diffusion tensor imaging in fixed primate brain. Neuroimage. (2007) 35:553–65. doi: 10.1016/j.neuroimage.2006.12.028
52. D'Arceuil H, de Crespigny A. The effects of brain tissue decomposition on diffusion tensor imaging and tractography. Neuroimage. (2007) 36:64–8. doi: 10.1016/j.neuroimage.2007.02.039
53. Dyrby TB, Baaré WFC, Alexander DC, Jelsing J, Garde E, Søgaard LV. An ex vivo imaging pipeline for producing high-quality and high-resolution diffusion-weighted imaging datasets. Hum Brain Mapp. (2011) 32:544–63. doi: 10.1002/hbm.21043
Keywords: MRI, DTI, tractography, equine, white matter tracts
Citation: Boucher S, Arribarat G, Cartiaux B, Lallemand EA, Péran P, Deviers A and Mogicato G (2020) Diffusion Tensor Imaging Tractography of White Matter Tracts in the Equine Brain. Front. Vet. Sci. 7:382. doi: 10.3389/fvets.2020.00382
Received: 04 March 2020; Accepted: 29 May 2020;
Published: 30 July 2020.
Edited by:
Mário Ginja, University of Trás-os-Montes and Alto Douro, PortugalReviewed by:
Raluca Pascalau, Johns Hopkins University, United StatesAntonella Castellano, Vita-Salute San Raffaele University, Italy
Copyright © 2020 Boucher, Arribarat, Cartiaux, Lallemand, Péran, Deviers and Mogicato. This is an open-access article distributed under the terms of the Creative Commons Attribution License (CC BY). The use, distribution or reproduction in other forums is permitted, provided the original author(s) and the copyright owner(s) are credited and that the original publication in this journal is cited, in accordance with accepted academic practice. No use, distribution or reproduction is permitted which does not comply with these terms.
*Correspondence: Samuel Boucher, samuel.boucher@inserm.fr
†These authors have contributed equally to this work
‡These authors share last authorship